
Last updated on June 23rd, 2026 at 01:41 pm
Guesswork is out. Data is in. If your emails are getting ignored, social posts aren’t landing, or your website isn’t turning visitors into customers, it’s time to start asking questions. User analytics will tell you. Here’s how to start adjusting the three key strategies where your analytics can make the biggest impact.
Small adjustments in email, social media, and your website (that can be made today) have the potential to earn better engagement, more conversions, and stronger results—with minimal added effort.
1) Email and Automation
Email marketing works best when it feels personal, not like a shot in the dark. If your current strategies aren’t getting emails opened or clicked, analytics can tell you exactly what things need adjusting—so you can fix them.
Most email marketing platforms and CRMs provide built-in analytics that help track performance. If you’re not sure where to start, focus on campaign reports, automation performance, and your list health.
Your CRM platform (think ActiveCampaign, Mailchimp, or HubSpot) should provide insights on things like open rates, click-through rates (CTR), and unsubscribes for anything you send out.
If you have automated sequences set up (like welcome emails, scheduled service reminders, or lead nurturing), check reports for those sequences to see where subscribers are dropping off.
In Google Analytics, you can go to Acquisition and see how much website traffic comes from email links.
Lastly, email and CRM platforms often show contact and list metrics like subscriber growth, bounce rates, or other engagement trends in Audience Insights or List Performance.
Putting Email Analytics into Action
As a disclaimer, the benchmarks for all the metrics below will vary widely from industry to industry! But depending on the numbers you see, here are some adjustments you could consider.
Low open rates?
Based on the cross-industry average of 17%-28%, if you’re seeing email open rates below that, your subject lines might not be grabbing attention.
- A/B test different styles—questions, urgency, emojis, or personalized names.
- Keep subject lines under 50 characters for better visibility on mobile devices.
- Avoid words and terms that can be spam triggers like “Free,” “Urgent,” or excessive punctuation.
- Send emails at different times based on engagement trends in your reports
Low click-through rates?
A strong CTR is generally between 2%-5%, but if people open your email and don’t seem to take action, the content or CTA (call-to-action) needs work.
- Keep emails concise with clear takeaways—if it’s too long, readers lose interest.
- Use buttons instead of text links to make CTAs more noticeable.
- Check heatmaps (via Google Analytics or email tracking tools) to see which links get ignored.
- Place the most important link or CTA above the fold (before users have to scroll).
High unsubscribe rates?
Generally, you want to see your unsubscribe rate lower than 0.5%-1%. If people are opting out faster than they’re signing up, you might be:
- Sending emails too frequently—check engagement trends and consider reducing sends.
- Targeting the wrong audience—review segmentation settings to ensure relevancy.
- Writing content that’s too promotional—balance sales with helpful, value-driven messaging.

Health scores in HubSpot in HubSpot marketing email
Automation drop-offs?
If subscribers or leads disengage mid-sequence, check on…
- The timing; are emails being sent too close together, overwhelming the reader? Spacing them out can help.
- Your content flow; does each email naturally lead to the next? Reorder emails if needed.
- Engagement triggers; add re-engagement emails for subscribers who stop interacting.
The key is to be curious—testing, tracking, and refining should become a part of your strategic routine, and you will develop an eye for what to spot and changes to make.
Even small things, like adjusting a subject line or email timing for your newsletter, can lead to significant improvements.
Example: If a welcome series loses engagement after the second email, adjusting the messaging or timing of that email could improve retention.
2) Social Media
Social media moves fast. What worked last month might not work today, and posting without a strategy won’t get results (well, not the ones you want).
If engagement feels stagnant or your audience isn’t growing, don’t just keep throwing content into the void. Pretty much every platform offers built-in data to track performance.
If engagement is dropping, follower growth has stalled, or your content isn’t driving traffic, pretty much every platform offers built-in analytics. Plus, you can take a look at certain things in Google Analytics.
If it looks like Greek, start with:
- Post Performance: Likes, comments, shares, and saves show what resonates.
- Audience Insights: Demographics, follower growth, and peak activity times help refine targeting.
- Reach & Impressions: Low reach means your content isn’t showing up—timing, format, or hashtags may need adjusting.
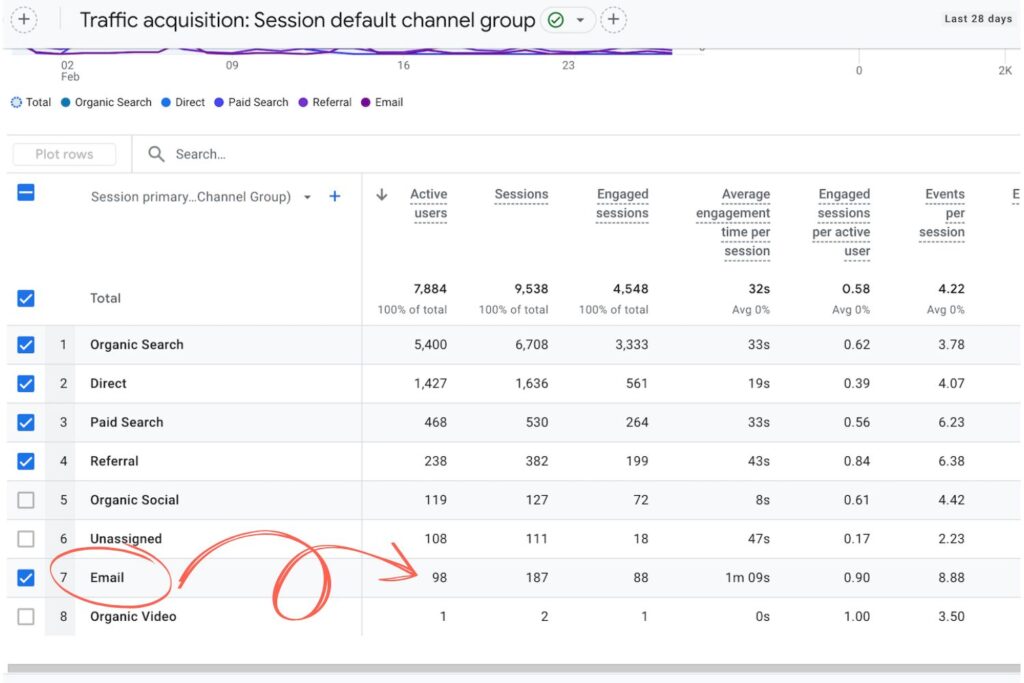
- Traffic Acquisition: Just like your emails, you can check how many users make it to your site from your social platforms. In Google Analytics, check network referrals within Acquisition reporting to see which platforms are driving the most traffic.

Report view analyzing various post types and comparing engagement vs total reach
Putting Social Analytics into Action
If you’re putting in work but your numbers aren’t where they should be, here’s how to approach adjustments:
Minimal engagement?
If it seems like the algorithm is only showing your posts to ghosts:
- Compare your top-performing and lowest-performing posts—what’s different?
- Experiment with content formats. Try authentic videos, carousels, polls, or behind-the-scenes content.
- Try to make sure captions encourage interaction. “What’s one challenge you’ve faced with [topic]?”
- Reply to comments and DMs—conversations boost your visibility.
Reach is low?
This one can be hard to pin down since reach can vary so much across platforms and content formats. But according to Social Insider’s benchmarks for 2025, your content could be in the wrong place at the wrong time if it’s reaching less than 6% of your total followers.
- Check when your audience is most active (on Instagram: Insights > Your Audience > Most Active Times / on Facebook: Meta Business Suite > Insights).
- Post during peak engagement hours instead of at random.
- Use a mix of trending and niche hashtags or audios to expand reach.
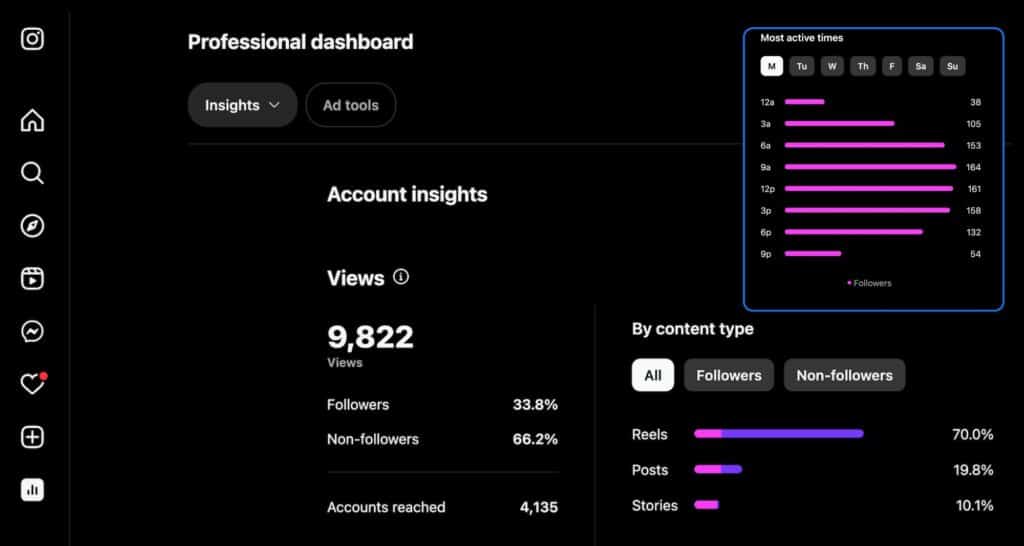
Instagram Insights dashboard & audience most active times
No audience growth?
If follows and engagement is coming from all the same people–or the wrong ones–consider:
- Refining content topics to align with what your ideal audience actually cares about.
- Engaging with relevant accounts—commenting and interacting builds visibility.
- Reassessing paid promotions—broad audience targeting often leads to irrelevant engagement.
Barely any traffic from social?
If you’re getting engagement but posts aren’t driving clicks, try:
- Make CTAs clearer—tell users why they should want to click.
- Use link stickers in Stories and clickable links in bios for easier access.
- Test different CTA placements or stronger hooks before the link.
Simple Tips
- Pin a top-performing post to the top of your feed so new visitors see it first.
- Repurpose high-engagement posts—turn a great carousel into a short video.
- Use Instagram & Facebook’s “Save” metric to identify valuable content. Posts with high save counts signal what your audience finds useful.
- Engage before and after posting. Responding to comments and interacting with followers increases visibility.
3) SEO and Site Performance
A truly strong website does more than look good—although it should do that, too.
The goal is to keep visitors engaged and lead them toward action. If visitors aren’t sticking around, clicking through, or converting, Google Analytics and Google Search Console offer customizable reports to help you see what’s going on and start adjusting strategies accordingly.
Where is your website traffic coming from? In Google Analytics, the Acquisition Overview will report if visitors are coming from search engines, social media, paid ads, or referrals.
Which pages are getting the most visits? Check Behavior reports to see which pages bring in the most traffic and how long users stay. If they leave quickly without taking action, something may be off—content, load speed, or user experience.
88% of users won’t return to a site after a bad user experience.
In Google Search Console, look at which search queries bring traffic your way and how your site ranks for them.
Putting Site Analytics into Action
After spending a little time with your analytics, you might have an idea of what needs the most attention. Here are some possible fixes for big site metrics:
Too much bouncing around?
If users leave quickly, something drives them away.
- Improve site speed by compressing images and removing unnecessary scripts.
- Make sure the page delivers what was promised in the search result.
- Add clear navigation and easy-to-find CTAs to guide users to the next step.
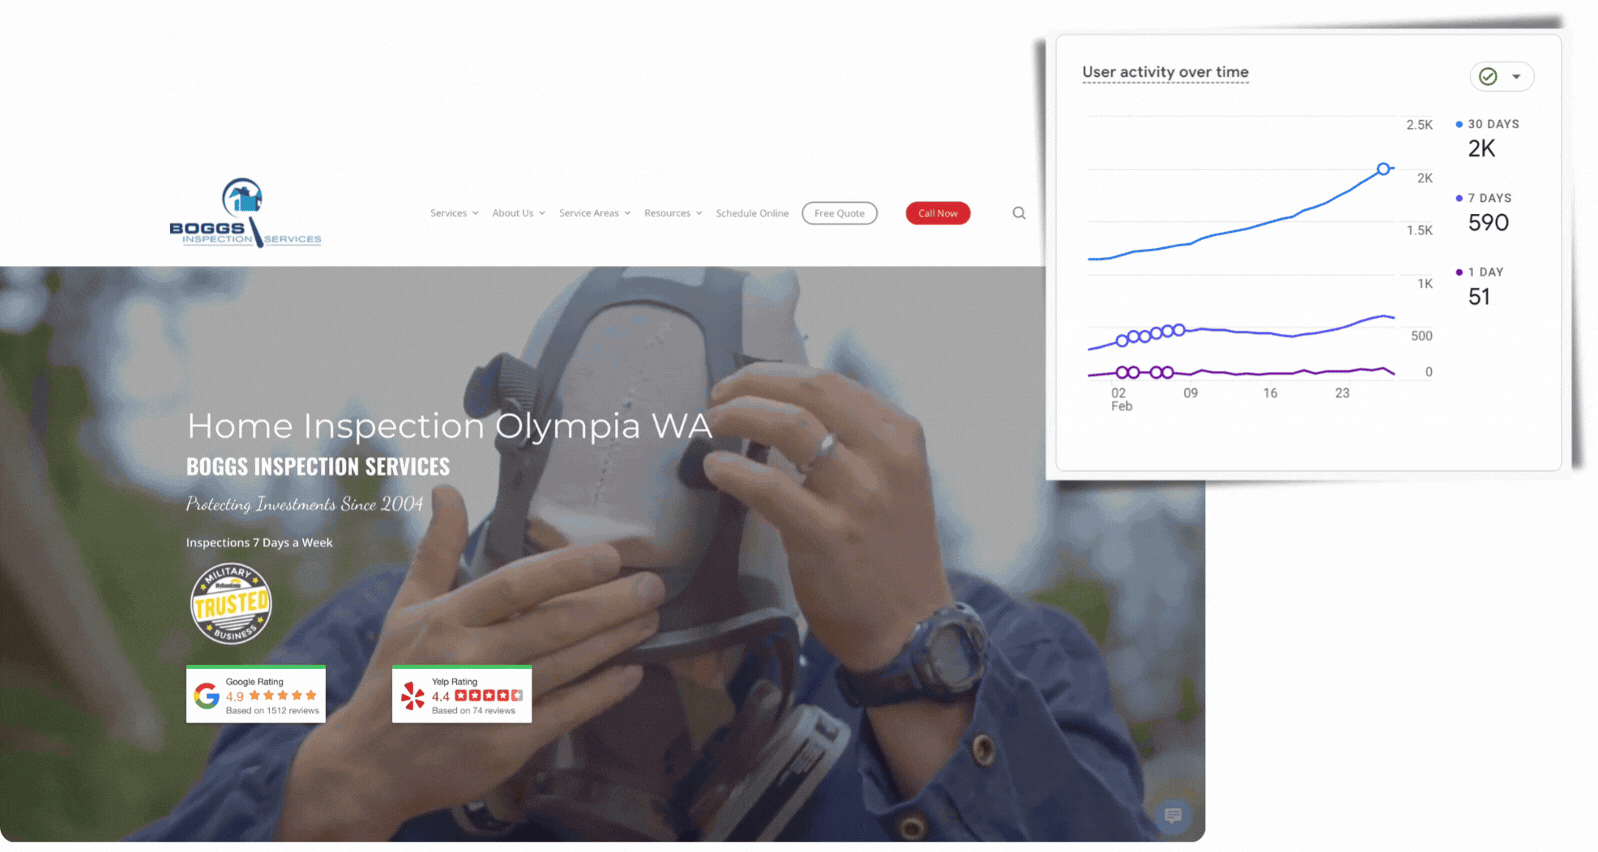
Site user activity growing over a 30-day period with an optimized site & clear CTAs
Conversions are low?
If visitors aren’t booking, ordering, or signing up, your analytics can help you start adjusting your strategies…begin by testing:
- Different CTA placements and wording—sometimes a small tweak can increase clicks.
- More compelling, benefit-driven headlines.
- Simplified forms—fewer fields make it easier for users to complete an action.
Traffic dropping?
Fewer people are finding your site through search—why? In platforms like our trusty Google Analytics, Search Console, or SEMRush, you can check out which pieces of your SEO and content strategies need adjusting. Start here:
- Check keyword rankings and update underperforming or old content.
- Add internal links to high-value pages.
- Refresh old blog posts with updated information and recent data.
Not enough clicks?
Note if there’s not a lot of on-page engagement happening.
- Break up text with subheadings, bullet points, and visuals. No one wants to read or scroll through word walls.
- Move the most important information higher on the page.
- Add interactive elements like videos or clickable FAQs.
Example
If a landing page is getting plenty of visitors but few conversions, testing a different CTA placement, headline, or page structure could improve your results or point you in the right direction.
Adjusting Based on Analytics Over Time
At the end of the day, analytics can be overwhelming if you spend hours at a time staring them down.
More than half of people who handle marketing in their day-to-day feel that they spend too much time analyzing data.
Keep it to 20 minutes at a time, and you’ll thank me later. However, it can also save a lot of work for you. Even small, consistent adjustments add up to smarter marketing decisions over time. Build a simple routine to check your data and make improvements.
Just as an example:
- Weekly: Review social media insights and email performance. Test small adjustments, like tweaking posting times or subject lines.
- Monthly: Check website traffic and search rankings. Identify trends in engagement, conversions, and where visitors drop off.
- Quarterly: Audit your overall strategy. What’s improved? What needs a bigger shift? Refresh underperforming content and refine your targeting.
Conclusion
Analytics take the guesswork out of adjusting your strategies. Instead of assuming what works, use real data to make small but powerful adjustments. Test a subject line, tweak your social posting schedule, optimize a landing page, and observe. Over time, these small data-driven changes add up to stronger results and less wasted effort.
Need help turning analytics into action? Wolfpack Advising helps businesses make sense of the numbers and optimize for success. Let’s start refining your strategy today.