
Last updated on June 23rd, 2026 at 01:41 pm
In the digital marketing landscape, Google Analytics reigns supreme as the go-to tool for data-driven insights. An essential feature to master within this powerful platform is dimensions, and more specifically, the secondary dimension. But what is a secondary dimension in Google Analytics exactly? And how can it enhance your data analysis?
Simply put, secondary dimensions delve deeper into your Google Analytics data, providing additional context for more robust insights. Below, we’ll explore secondary dimensions in depth to understand their crucial role in extracting precise insights from your website’s performance.
Whether you’re an experienced user or a Google Analytics novice, this exploration of secondary dimensions has the potential to elevate your data analysis game.
Understanding Dimensions in Google Analytics
Before we plunge into the world of secondary dimensions, let’s clarify ‘dimensions’ within Google Analytics. Dimensions are labels or descriptors that help us comprehend our data. They provide details about our website visitors, their activities, and their origins.
For instance, the ‘City’ dimension indicates the city from where a website visit originated. The ‘Page Title’ dimension reveals the specific pages that users browsed on our website. These dimensions attached to our data, like page views or time spent on our site, paint a comprehensive picture of our website’s activity.
Every report in Google Analytics begins with a primary dimension, such as ‘Source’, ‘Medium’, or ‘Page’. However, if you want to uncover more about your website visitors’ activities, secondary dimensions offer additional depth.
So, we’ve now got a basic understanding of what dimensions are in Google Analytics. Up next, we can focus more on secondary dimensions and how they can give us even more useful insights from our data.
Introduction to Secondary Dimensions
This feature, while sounding a bit complex, is quite straightforward and incredibly useful when examining your data. In Google Analytics, a secondary dimension is essentially an additional data layer that you apply to your reports to refine and expand your understanding of the primary dimension. It’s like adding a magnifying glass to your data analysis, allowing you to see more granular, specific details about your website’s performance.
For example, let’s say your primary dimension is ‘Page Title’, which tells you the specific pages users have visited on your website. By applying a secondary dimension of ‘City’, you can then further understand which cities those page views are coming from. This combination can provide valuable insights. For instance, you might discover that a particular blog post is popular among visitors from New York, prompting you to tailor future content towards that audience.
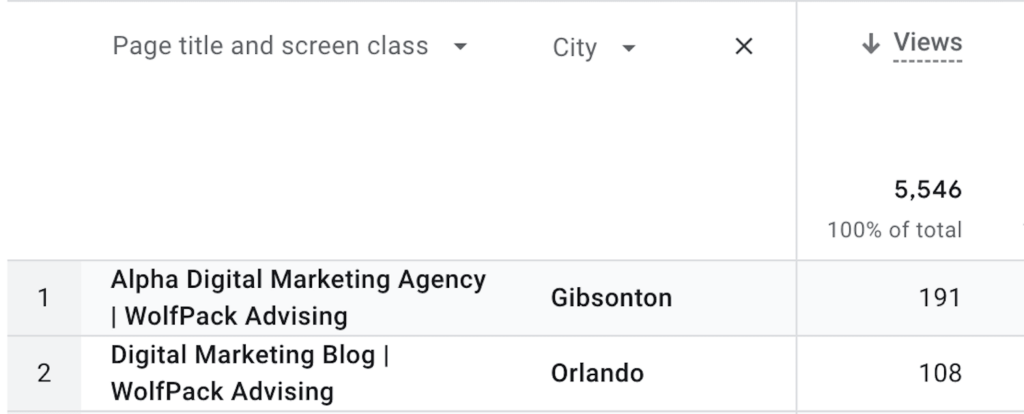
Report With ‘Page Title’ & ‘City’ as Dimensions – Reflecting Where Some Page Views Originated From
In this way, the secondary dimension enhances the primary one, enabling a nuanced understanding of website performance and visitor behavior. It reveals deeper, less obvious insights.
The beauty of the secondary dimension lies in its flexibility within Google Analytics. The platform offers hundreds of them, meaning you can mix and match them with your primary dimension to gain the precise insights you need. With the right combination, you can uncover powerful insights that can guide your digital marketing strategy.
Importance of Secondary Dimensions in Google Analytics
The power of this tool in Google Analytics cannot be overstated. While primary dimensions provide a comprehensive overview of your data, secondary dimensions offer a meticulous, in-depth analysis that can lead to valuable insights and help shape your marketing strategies. Here’s why secondary dimensions are so vital:
Detailed Data Analysis
Secondary dimensions allow you to dissect your data in a more granular way. By adding a secondary dimension, you can break down your primary dimension data into smaller, more precise chunks, helping you understand your audience and their behavior in a more nuanced way. This specificity can reveal hidden patterns or trends that can inform your marketing decisions.
Customized Reports
With secondary dimensions, you can customize your Google Analytics reports to suit your specific needs. Whether you’re curious about your audience’s geographical distribution, their devices, or the referral sources driving traffic to your site, secondary dimensions can help you tailor your reports to answer these questions.
Enhanced Decision Making
The insights gained from using secondary dimensions can significantly enhance your decision-making process. They can help you identify which marketing channels are most effective, where your audience is primarily located, what content they engage with, and more. This information is crucial for making informed decisions about your marketing strategies.
Better User Understanding
Understanding your audience is key to successful digital marketing, and secondary dimensions provide a pathway to that understanding. By combining different dimensions, you can build a more detailed picture of your audience’s behavior, interests, and demographics, helping you create more targeted and effective marketing campaigns.
Applying Secondary Dimensions in Google Analytics
Now that we understand the importance of secondary dimensions and how they can enhance your data analysis, let’s walk through the steps to select and apply a secondary dimension in Google Analytics. The process is deceptively straightforward and can be mastered with a bit of practice.
For our example, we’ll use the common secondary dimension “Device Category.”
Step 1: Select a Report
Start by logging into your Google Analytics account and select the report you want to analyze. You could choose from various reports under ‘Real-time’, ‘Audience’, ‘Acquisition’, ‘Behavior’, or ‘Conversions’, depending on what you’re interested in.
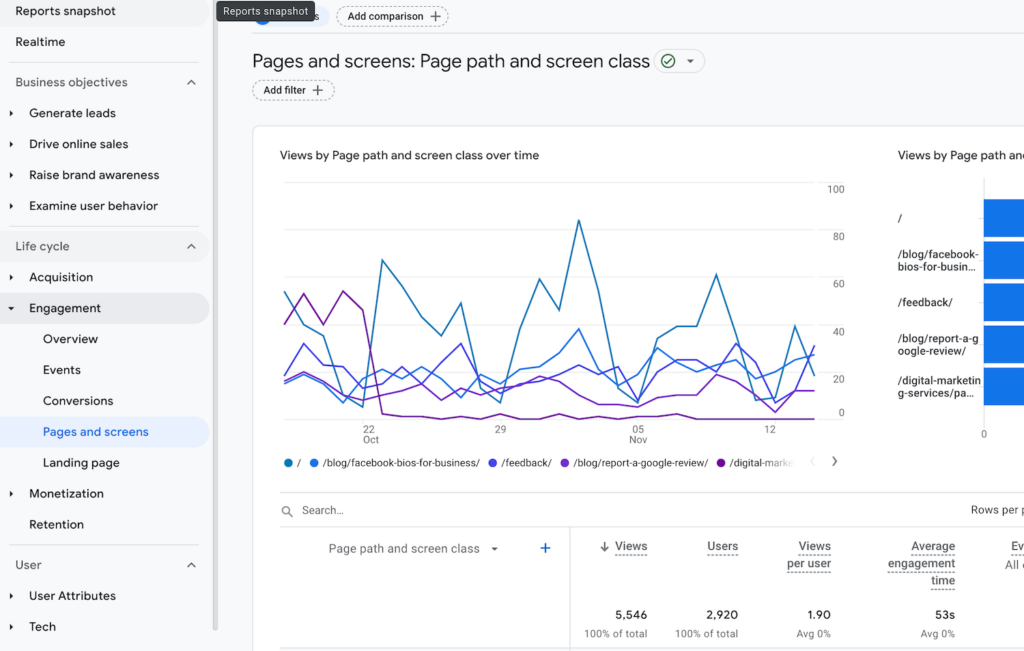
‘Pages and Screens’ Under ‘Engagement’ as Selected Report
Step 2: Choose a Primary Dimension
Once you’ve selected a report, in the table, you’ll see the primary dimension. This could be something like ‘Source’, ‘Medium’, or ‘Page Title’, depending on the report you chose.
Step 3: Add a Secondary Dimension
To the right of the primary dimension, you’ll see a dropdown menu labeled ‘Secondary dimension’. Click on this menu to see a list of available secondary dimensions. You can scroll through this list, or use the search bar to find a specific dimension.
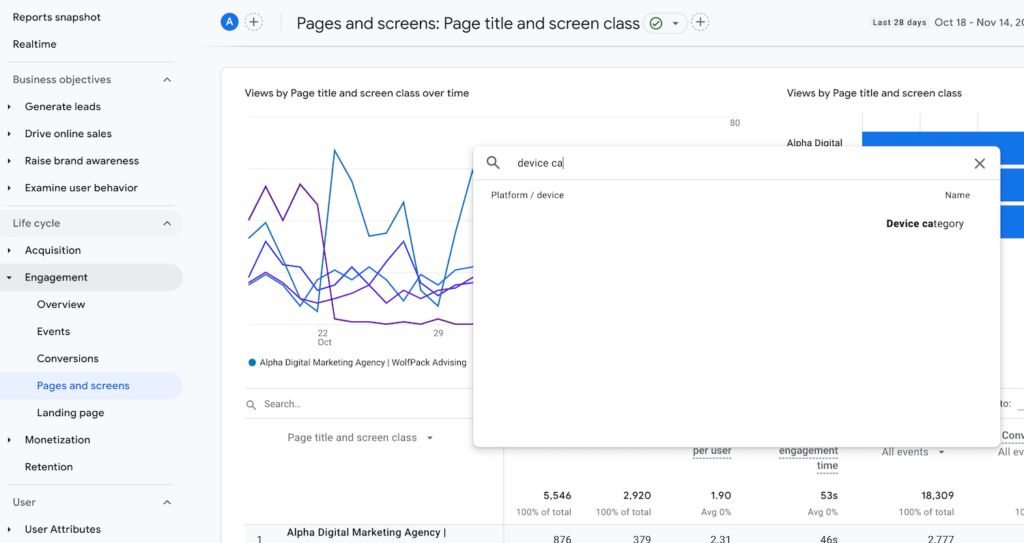
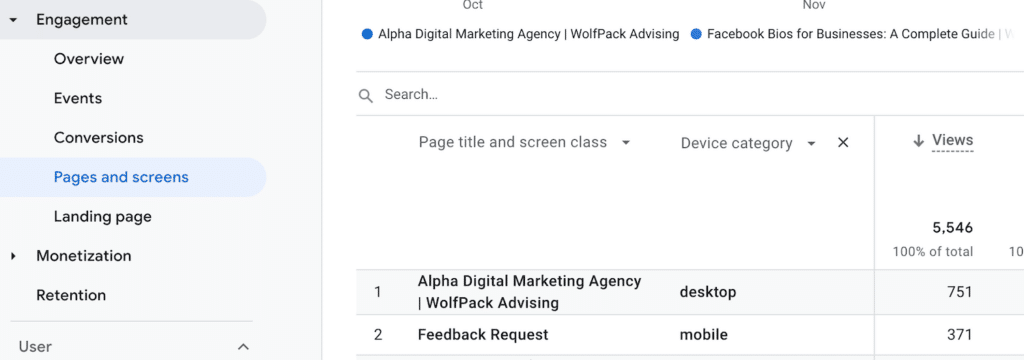
‘Page title and screen class’ as Primary Dimension, ‘Device category’ in Search for Secondary Dimension
Step 4: Apply the Secondary Dimension
Once you find the secondary dimension you want to use, click on it. The data table will refresh, and your secondary dimension will appear next to your primary dimension in the table. You can now analyze your data with the additional context provided by your secondary dimension.
It’s important to note that the secondary dimension you choose should complement your primary dimension. You can experiment with different combinations of primary and secondary dimensions to find the one that provides the most valuable insights for your needs.
Primary and Secondary Dimensions Applied in Google Analytics
Practical Examples of Secondary Dimensions in Google Analytics
With a grasp of choosing and applying secondary dimensions in Google Analytics, let’s look at some practical examples illustrating their potential. These examples will showcase how secondary dimensions can enhance your understanding of your data and help drive strategic decision-making.
To Understand Traffic Sources
Suppose your primary dimension is ‘Source/Medium’, which tells you where your traffic comes from, and you choose ‘Country’ as your secondary dimension. This combination can give you a geographical breakdown of your traffic sources.
For example, you can determine how much of your Facebook traffic comes from the United States versus other countries. This insight can help you tailor your social media strategy to cater to audiences in specific locations.
To Analyze User Behavior
Let’s say your primary dimension is ‘Page Title’, showing the specific pages users have visited, with ‘Time on Page’ as your secondary dimension. This combination can help you understand how long users spend on different pages of your website. If users spend a lot of time on a specific blog post, for example, you might decide to create more content on that topic.
To Optimize Landing Pages
If your primary dimension is ‘Landing Page’, showing where users enter your site, and ‘Device Category’ is your secondary dimension, you can see which devices users are using to access your landing pages. If a significant amount of traffic comes from mobile devices but your landing page is not mobile-friendly, this insight could prompt you to optimize your landing page for mobile users.

Common Mistakes to Avoid When Using Secondary Dimensions
While secondary dimensions in Google Analytics are a powerful tool, they can also lead to potential confusion. Here are a few common mistakes to avoid:
Misinterpreting or Overcomplicating the Data
One of the most common mistakes is misinterpreting what the data is showing. Remember that the secondary dimension is applied to each individual row of your primary dimension. It’s crucial to make sure you understand the relationship between your primary and secondary dimensions to avoid drawing incorrect conclusions.
While it’s tempting to dive deep into your data with secondary dimensions, try not to overcomplicate your analysis. Sometimes, a simple view can provide the most actionable insights. Select secondary dimensions that complement your primary dimension and help answer your specific questions.
Ignoring Context
Context is key when interpreting your data! Make sure to consider external factors that could be influencing your data. For example, if you see a spike in traffic from a particular city, it might be due to a recent marketing campaign targeting that location.
Remember, the usefulness of the secondary dimension depends on the questions you’re trying to answer. Always start with a clear objective in mind, then choose your dimensions accordingly.
Final Thoughts
In essence, a secondary dimension in Google Analytics is a powerful tool for enhancing your data analysis. It’s a way to dissect your data in more detail, customize reports, and make more informed decisions about your marketing strategies. Understanding how to use this feature and avoiding common pitfalls can unlock deeper insights into your website’s performance and your audience’s behavior.
Remember, the power of Google Analytics lies not just in the wealth of data it provides, but also in your ability to interpret and apply that data effectively. So, experiment with different combinations of primary and secondary dimensions, keep exploring, and keep learning. If you have questions or want to learn more, don’t hesitate to schedule a consultation with WolfPack advising for further guidance and assistance.