Skip to content
New: Free AEO Grader. Score your site for AI search in 60 seconds. Try It

Ace Home Inspections Competes (and Wins) With Smart Google Ads

WolfPack's Local Service Ads earned Ace Home Inspections a 6.96x return on ad spend at a $22 cost per lead. Read the PPC case study.

Home InspectorsAdvertising

$22.27

Cost-Per-Lead

region average $28-$36

89.98%

Top-of-Page Visibility

region average ~80%

6.96x

Return-On-Ad-Spend

typical range 3x-5x

The story

How we got Ace Home Inspections results

Ace Home Inspections was founded in 2008 and has been a trusted name in the home inspection industry ever since. In January of 2023, Matt and Sarah Stonesifer acquired the company, bringing a fresh vision while maintaining the same commitment to excellence. With their leadership, Ace has grown significantly without sacrificing quality, serving the Capital Region of New York with the same dedication and professionalism our clients have come to expect.

As a growing inspection business, Ace needed to:

  • Gain visibility at the top of Google searches
  • Capture and convert quality leads affordably
  • Compete with established GLSA advertisers in the area
  • Track ROI through actual quotes and sales
Ace Home Inspections – The Challenge

To support Ace’s goals, we launched a performance-driven GLSA campaign focused on:

Ace Home Inspections – Our Solution

The plan

Hyper-Local Targeting: Albany and nearby suburbs
Budget Management: ~$475 per month
Conversion Optimization: Set up clear quote tracking and lead scoring
Visibility Domination: Aim for 90%+ top-of-page impression share

$22.27

Cost-Per-Lead
Region Average: $28-$36

89.98%

Top-of-Page Visibility
Region Average: ~80%

6.96x

Return-On-Ad-Spend
Typical Range: 3x-5x

Key Results

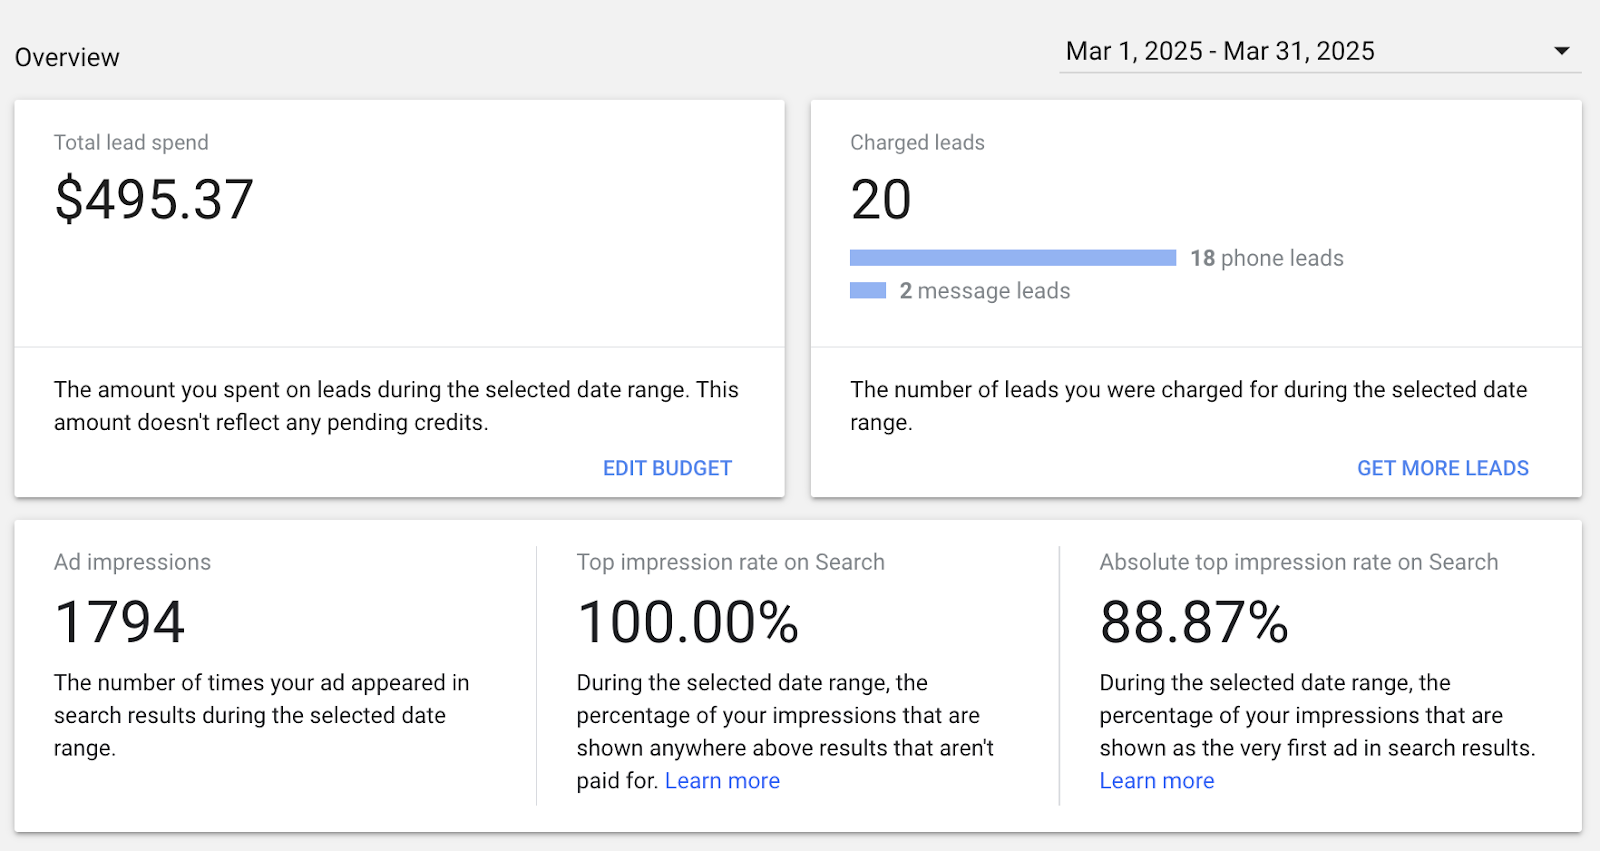
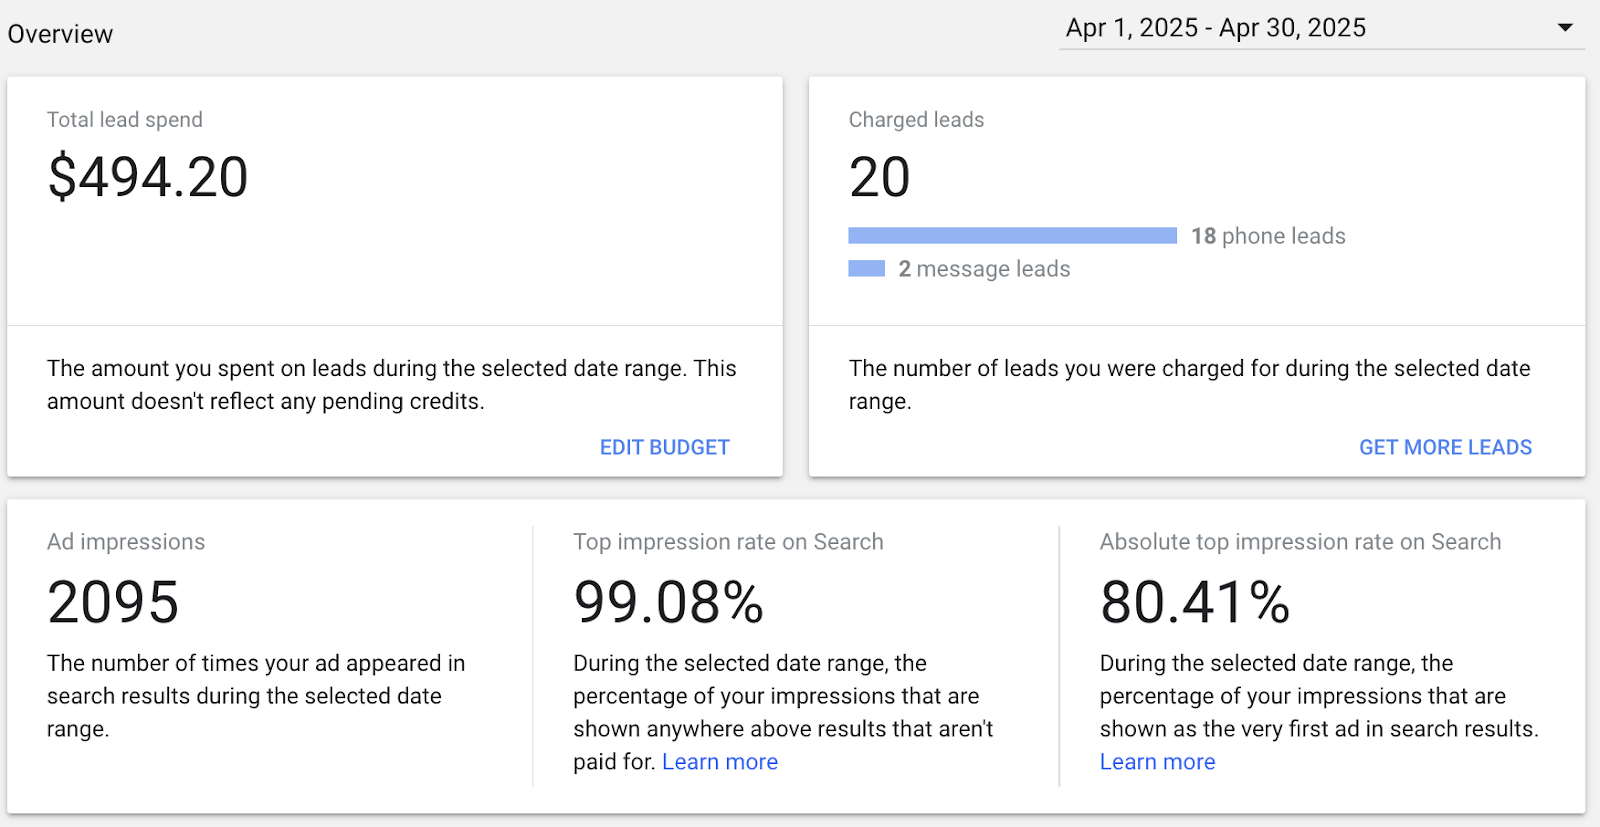
  • Consistent, quality lead generation throughout their 4 months with an average CPL of $22.27
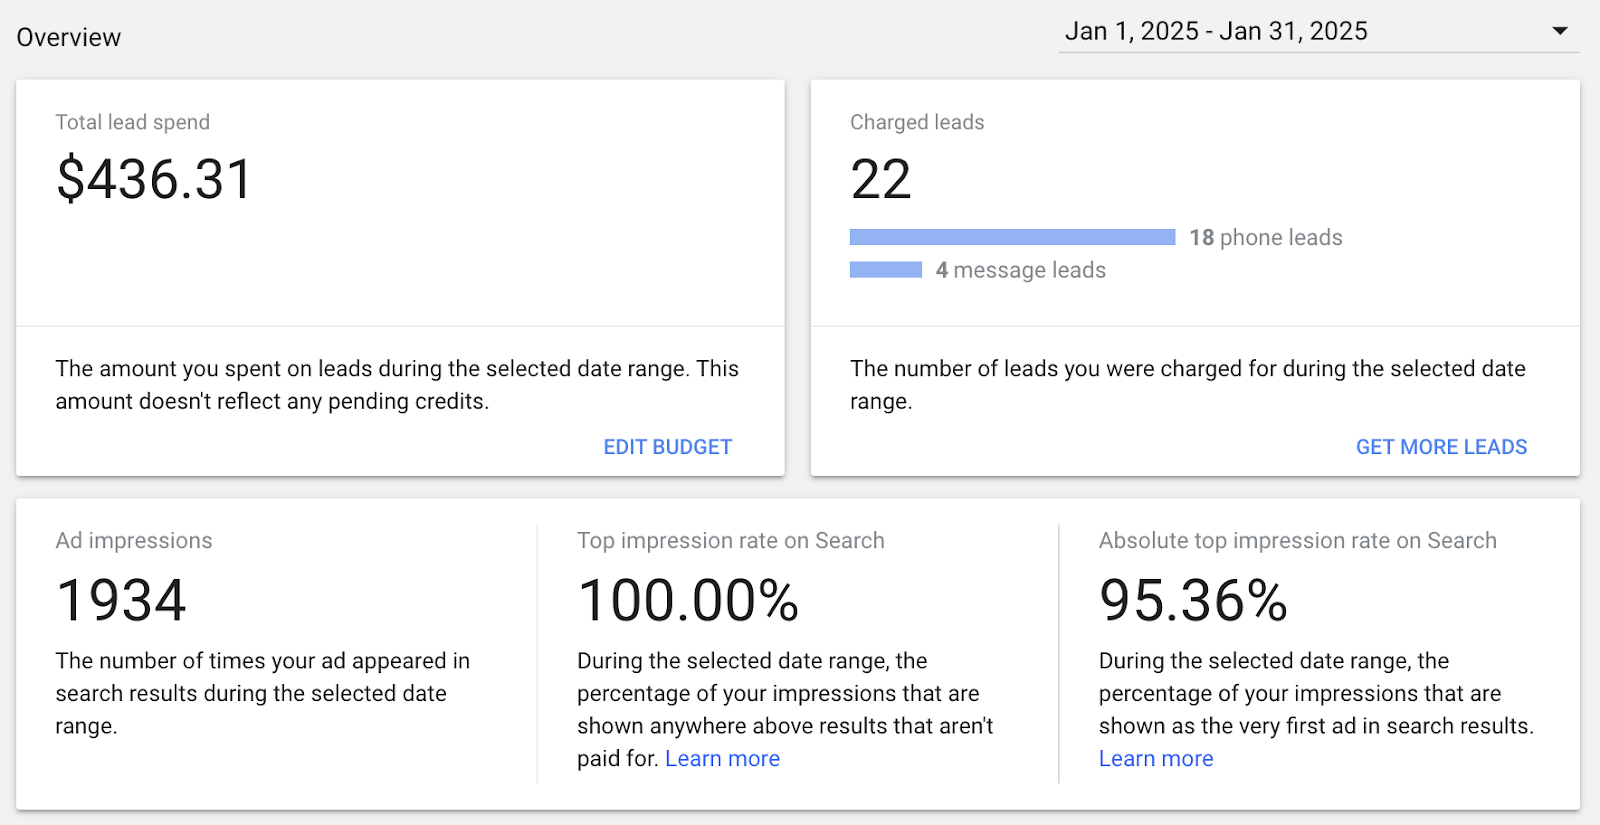
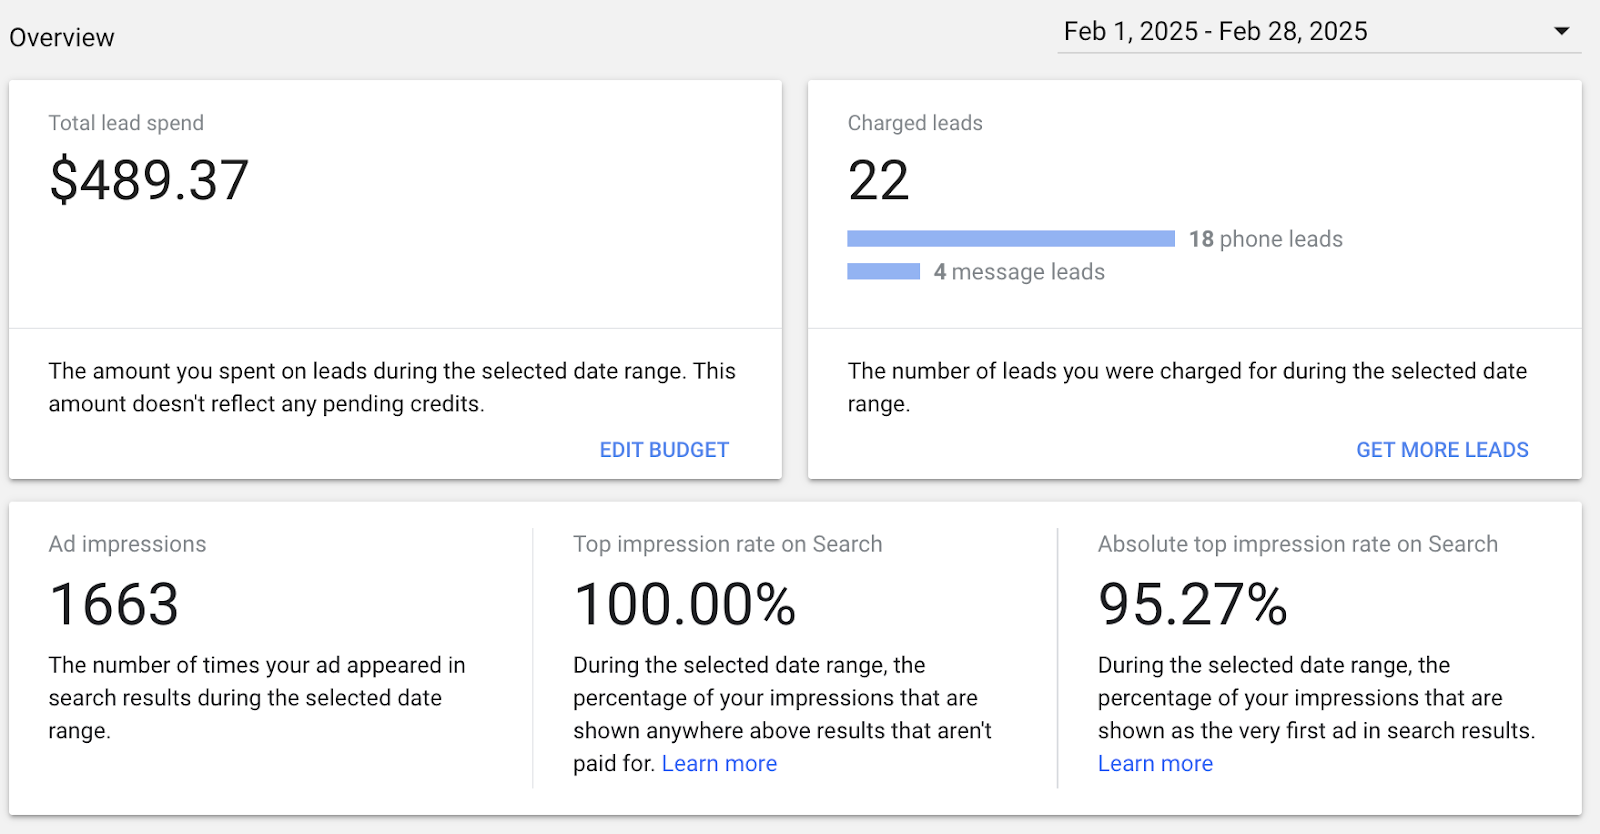
  • Incredibly efficient lead generation with 86 leads in a 4 month span
  • Strong top-of-page visibility with an 89.98% average absolute top impression rate
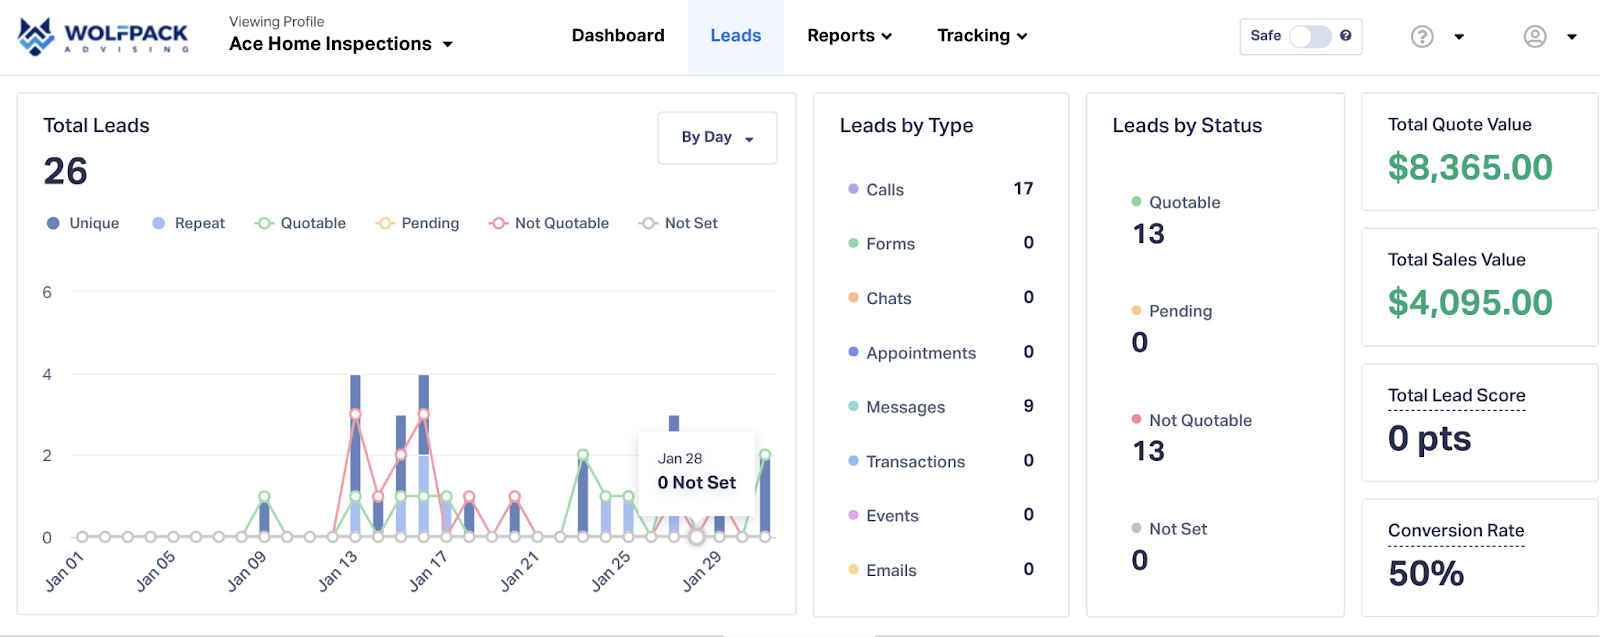
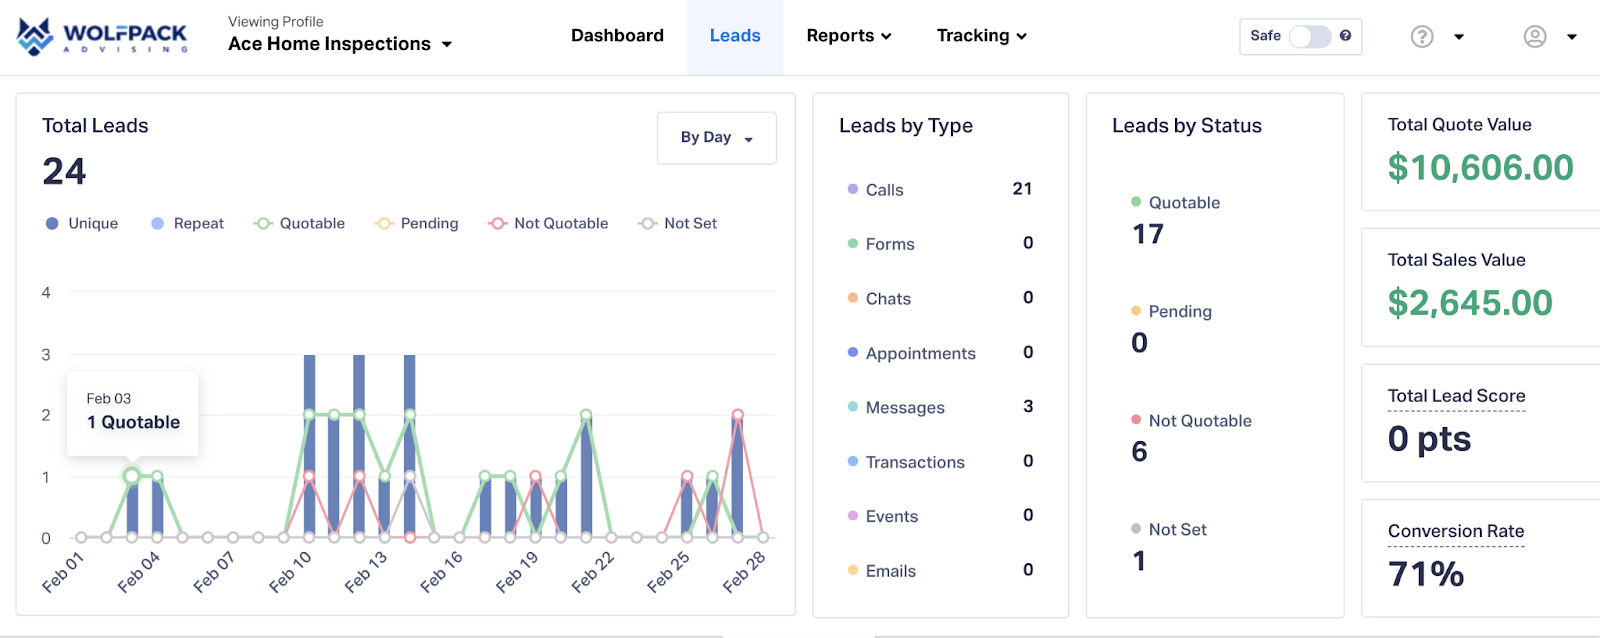
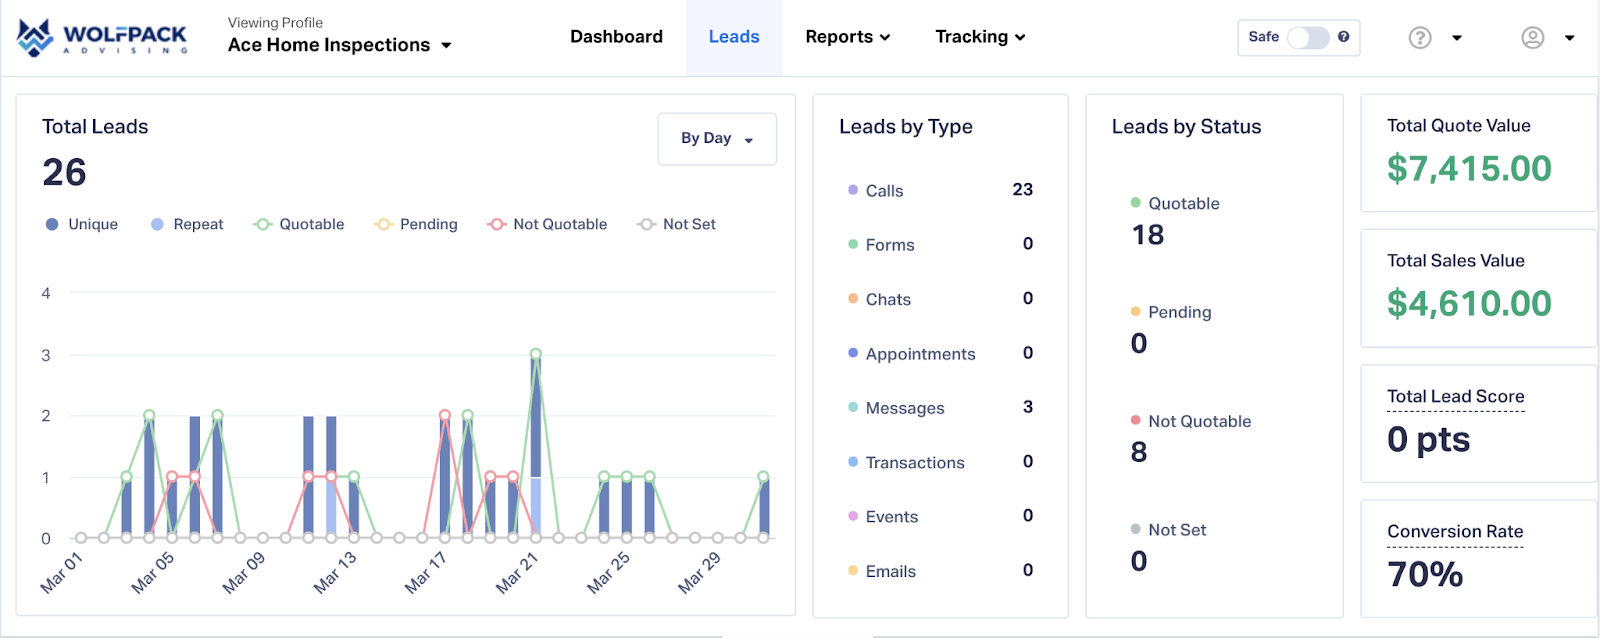
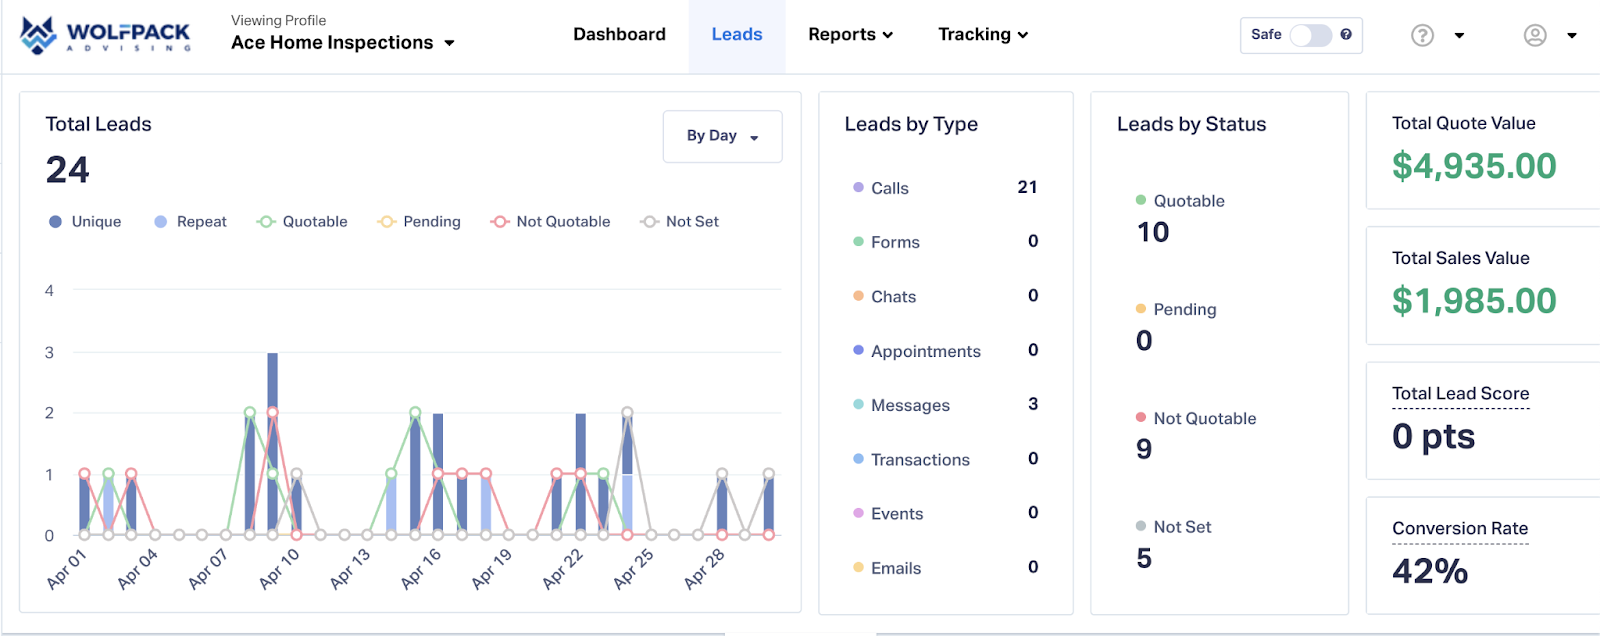
  • Quoted 16x their spend in tracked months ($31,321 quoted vs. $1,915.25 spent)
  • Over 6x average return on ad spend where sales were tracked
  • Average monthly sales of $3,333.75

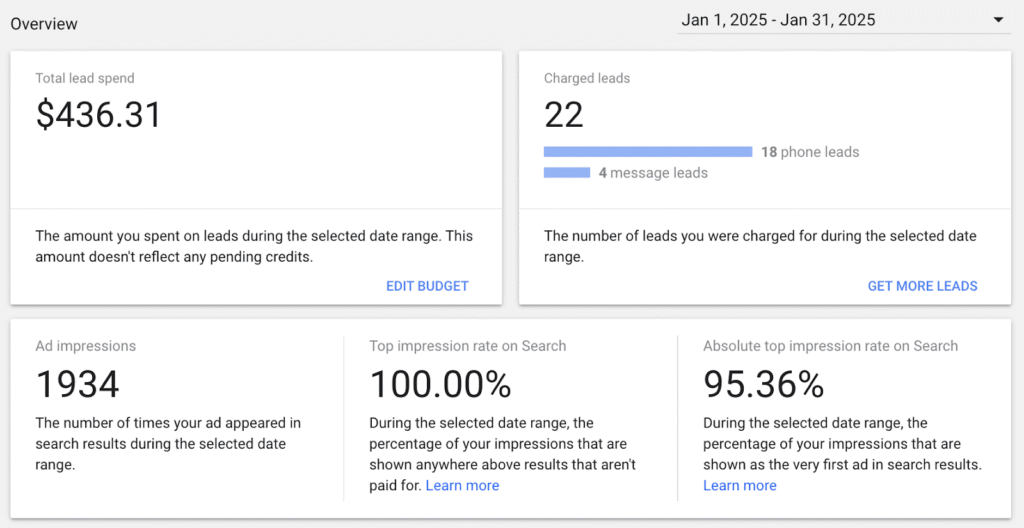
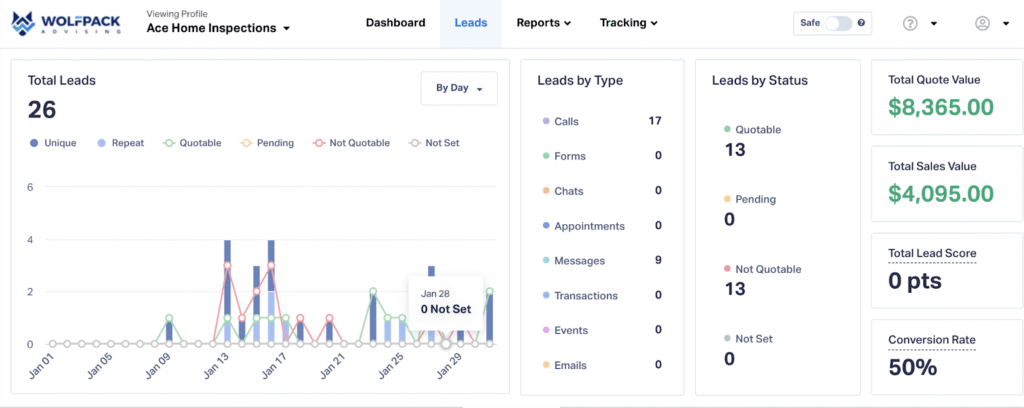
January 2025

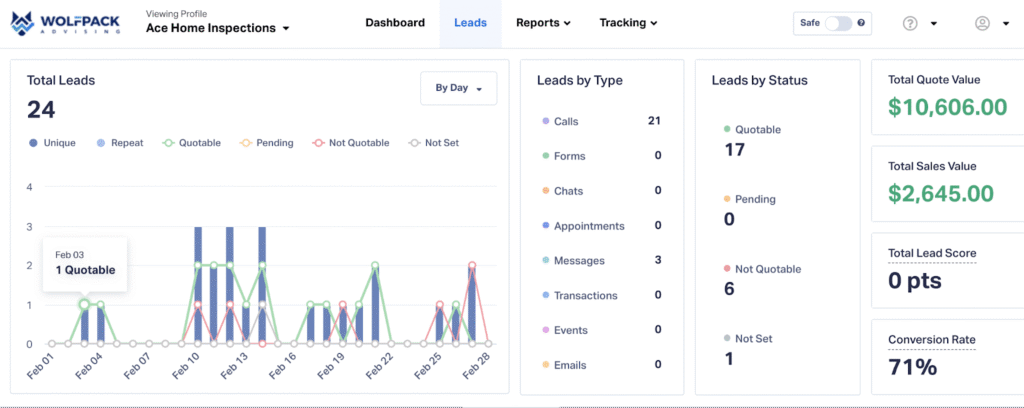
February 2025

March 2025

April 2025

From January 2025 through April 2025, the average monthly ROAS was approximately 6.96, meaning they earned $6.96 for every $1 spent on advertising during that time. While $6.96 ROAS might not sound extreme at first glance, for home inspections (a service-based, locally competitive industry), that’s a very strong and sustainable return and it’s across real tracked sales, not just quoted values. That number climbs even higher when considering total quoted value, indicating strong potential ROI beyond tracked sales.


Ace Home Inspections – The Results

By the Numbers

$22.27Cost-Per-Leadregion average $28-$36
89.98%Top-of-Page Visibilityregion average ~80%
6.96xReturn-On-Ad-Spendtypical range 3x-5x

More Results

Other Case Studies

Reviews

Real Results, Real People.

Save time, earn more, become alpha.

Tell us about your business goals to get a free proposal and dominate online.

Once a week. No spam ever.

One newsletter. Delivered straight to your inbox.

Your one-stop shop for

  1. Algorithm Updates
  2. Strategy Suggestions
  3. Industry-Specific Wins
  4. And More

Join the Pack

Get The Howler every week.

No spam. Unsubscribe anytime.